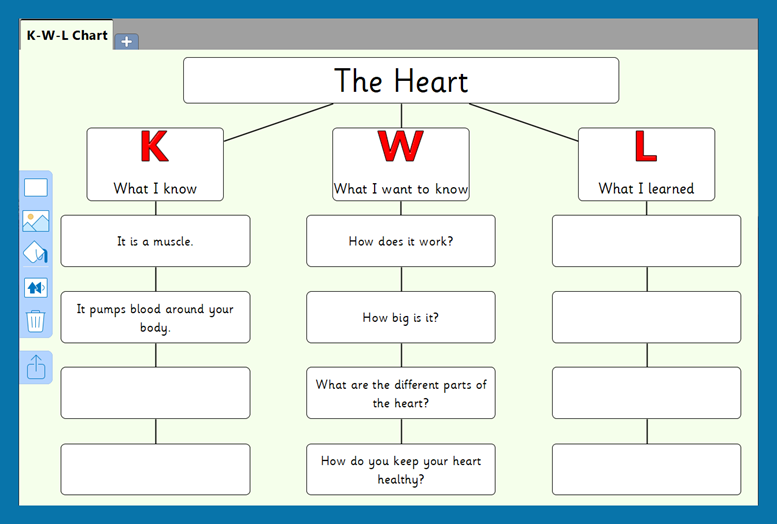
K-W-L charts are a great way to engage pupils in a new topic – helping them to recall knowledge, develop a purpose for learning, and track their progress. These graphic organisers are designed to highlight what you know (K), want to know (W), and have learned (L).
We’ve recently added a K-W-L chart on LearningGrids. The Clicker Board can be used effectively by individuals or groups on a computer or with an interactive whiteboard. The chart can also be printed out for use away from the computer.

Use the first column to assess or activate pupils’ prior knowledge. In the second column, get the pupils to plan their learning by generating a series of questions about the topic. Pupils then use the final column to summarise their learning. The first and last columns can be helpful for retrieval practice – trying to recall information without it in front of you to cement long-term learning.
The K-W-L chart can be used to support research on any topic, in any curriculum area. It could also be used when starting a new book or chapter to encourage more engagement with the reading. Or how about using it before and after going on a field trip to ensure that pupils are focused and make the most out of the educational visit?
Be sure to visit LearningGrids for other graphic organisers and planners.


